2.4.2. Hystrix Dashboard
Hystrix监控
除了隔离依赖服务的调用以外,Hystrix还提供了近实时的监控,Hystrix会实时、累加地记录所有关于HystrixCommand的执行信息,包括每秒执行多少请求多少成功,多少失败等。Netflix通过hystrix-metrics-event-stream项目实现了对以上指标的监控。
上文提到的microservice-consumer-movie-ribbon-with-hystrix项目已经具备对Hystrix监控的能力,下面我们进入测试。
测试步骤
启动:microservice-discovery-eureka
启动:microservice-provider-user
启动:microservice-consumer-movie-ribbon-with-hystrix
访问:http://localhost:8011/ribbon/1,注意:该步骤不能省略,因为如果应用的所有接口都未被调用,将只会看到一个ping
访问:http://localhost:8011/hystrix.stream,可以看到类似如下输出:
data: {"type":"HystrixCommand","name":"findById","group":"RibbonHystrixService","currentTime":1472658867784,"isCircuitBreakerOpen":false,"errorPercentage":0,"errorCount":0,"requestCount":0,"rollingCountBadRequests":0....}
并且会不断刷新以获取实时的监控数据。但是纯文字的输出可读性实在是太差,运维人员很难一眼看出系统当前的运行状态。那么是不是有可视化的工具呢?
Hystrix Dashboard
Hystrix Dashboard可以可视化查看实时监控数据。我们可以下载hystrix-dashboard的war包部署到诸如Tomcat之类的容器中,本文不做赘述。另外Spring Cloud也提供了Hystrix Dashboard的整合,下面我们看看Spring Cloud是怎么玩转Hystrix Dashboard的。
新建一个maven项目,在pom.xml中添加如下内容:
<?xml version="1.0" encoding="UTF-8"?>
<project xmlns="http://maven.apache.org/POM/4.0.0" xmlns:xsi="http://www.w3.org/2001/XMLSchema-instance"
  xsi:schemaLocation="http://maven.apache.org/POM/4.0.0 http://maven.apache.org/xsd/maven-4.0.0.xsd">
  <modelVersion>4.0.0</modelVersion>

  <artifactId>microservice-hystrix-dashboard</artifactId>
  <packaging>jar</packaging>

  <parent>
    <groupId>com.itmuch.cloud</groupId>
    <artifactId>spring-cloud-microservice-study</artifactId>
    <version>0.0.1-SNAPSHOT</version>
  </parent>

  <dependencies>
    <dependency>
      <groupId>org.springframework.cloud</groupId>
      <artifactId>spring-cloud-starter-hystrix-dashboard</artifactId>
    </dependency>
    <dependency>
      <groupId>org.springframework.boot</groupId>
      <artifactId>spring-boot-starter-actuator</artifactId>
    </dependency>
  </dependencies>
</project>
编写启动类:HystrixDashboardApplication.java
/**
 * 测试步骤:
 * 1. 访问http://localhost:8030/hystrix.stream 可以查看Dashboard
 * 2. 在上面的输入框填入: http://想监控的服务:端口/hystrix.stream进行测试
 * 注意:首先要先调用一下想监控的服务的API,否则将会显示一个空的图表.
 * @author eacdy
 */
@SpringBootApplication
@EnableHystrixDashboard
public class HystrixDashboardApplication {
  public static void main(String[] args) {
    new SpringApplicationBuilder(HystrixDashboardApplication.class).web(true).run(args);
  }
}
配置文件:application.yml
spring:
  application:
    name: hystrix-dashboard
server:
  port: 8030
启动后,访问http://localhost:8030/hystrix.stream将会看到如下界面:
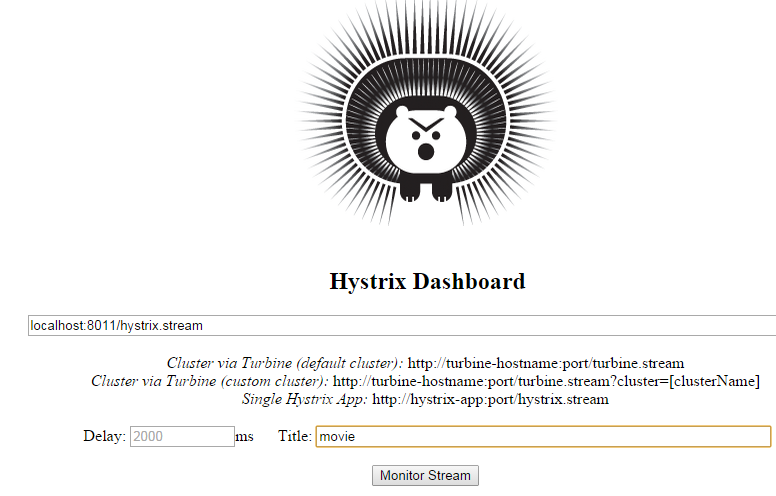
此时,我们在输入框中输入http://localhost:8011/hystrix.stream,并随意设置一个Title后,点击Monitor Stream按钮,会出现如下界面:
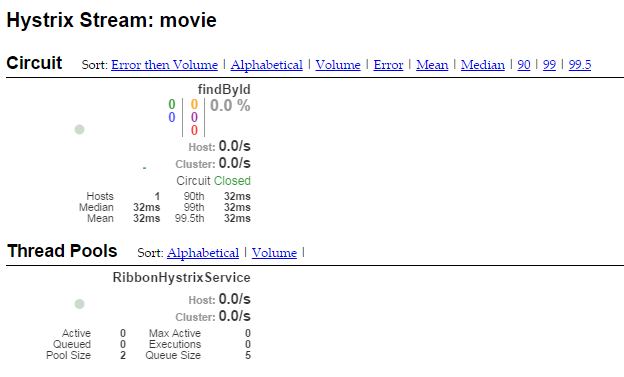
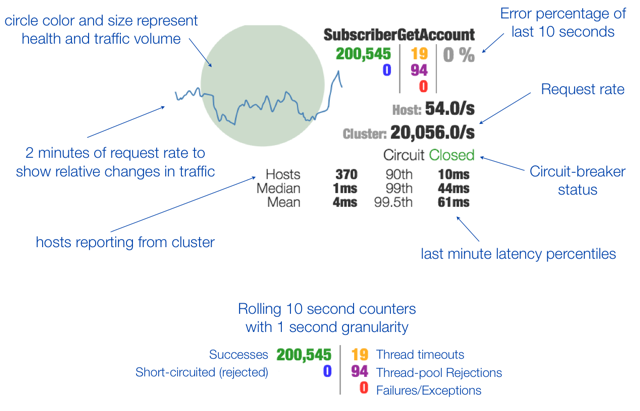
此时我们会看到findById这个API的各种指标。Hystrix Dashboard Wiki上详细说明了图上每个指标的含义,如下图:
此时,我们可以尝试将microservice-provider-user停止,然后重复访问多次http://localhost:8011/ribbon/1(20次以上),会发现断路器状态会变为开启。
代码地址(任选其一):
http://git.oschina.net/itmuch/spring-cloud-study/tree/master/microservice-hystrix-dashboard
https://github.com/eacdy/spring-cloud-study/tree/master/microservice-hystrix-dashboard
TIPS
Hystrix的监控数据默认是保存在每个实例的内存中的,Spring Boot提供了多种方式,可以导入到Redis、TSDB以供日后分析使用。
我们启动前文的
microservice-consumer-movie-feign-with-hystrix项目后发现其访问localhost:8021/hystrix.stream ,是404,查看pom.xml依赖树,发现其没有依赖hystrix-metrics-event-stream项目。故而添加依赖:<!-- 整合hystrix,其实feign中自带了hystrix,引入该依赖主要是为了使用其中的hystrix-metrics-event-stream,用于dashboard --> <dependency> <groupId>org.springframework.cloud</groupId> <artifactId>spring-cloud-starter-hystrix</artifactId> </dependency>并在启动类上添加
@EnableCircuitBreaker注解即可。详见项目microservice-consumer-movie-feign-with-hystrix-stream,因为这不是本文的讨论重点,故而只做扩展阅读。microservice-consumer-movie-feign-with-hystrix-stream代码地址(二选一):